
INTRODUCTION
It is obviously impossible to condense all the knowledge learned in this discipline into a single article of a few pages, since it has developed over more than a century of history and since it can be applied in dozens of different ways.
Therefore, a comparison will be made between traditional financial markets and the crypto sector, taking as reference points the basic principles of fundamental analysis.
The important thing will be to highlight as much the concepts that apply to both markets as the situations in which different and sometimes new methods need to be used: the goal will be to give general guidelines on how to navigate the world of investing and trading.
Fundamental analysis, which resembles more an art than an exact science, forms the basis on which those who operate in the financial markets try to establish as objectively as possible the appropriate value of a security or cryptocurrency in order to decide how to act: buy, sell or wait.
Through the study of the past, one tries not only to understand whether valuations and prices of financial assets are appropriate in the present but also to hazard guesses about changes in the relationship between supply and demand in the future.
If with fundamental analysis one identifies the context, that is, the direction in which the market is generally moving, then with technical-cyclical analysis one can determine likely price targets for entry and exit of a trade.
A third type of market analysis has emerged in the crypto sector:on-chain analysis, which is very interesting because it is complementary to both fundamental and technical-cyclical analysis.
Technical-cyclical analysis and on-chain analysis will be the subject of other articles, because if they were covered in this one it would run the risk of overstretching it.
Does it make sense to take valuable time to perform fundamental analysis? Certainly yes, but even excellent analysis cannot guarantee 100 percent satisfactory returns. In traditional finance, the correlation between good analysis and satisfactory returns is somewhat higher than in the crypto sector, and the causes lie mainly in the greater irrationality of traders and the greater ease with which crypto prices can be manipulated.
FUNDAMENTAL ANALYSIS IN TRADITIONAL FINANCE
SUBJECTS
Without necessarily having to resort to in-depth academic study, to carry out good analysis one would need to know the fundamentals of subjects such as:
- Accounting
- Macroeconomics
- Psychology
All three present the same level of importance.
Accounting (1) is used to evaluate a listed company by reading its a quarterly, semiannual and annual financial statements. Income Statement, Balance Sheet and Cash Flow Statement, both historical and recent, are essential documents for an investor who wants to get an idea about the economic and financial health of the company in which he or she would like to invest.
Of course, it is not compulsory to become an accountant in order to carry out fundamental analysis correctly, however, it is useful to know the main rules of Accountancy for very concrete reasons, including: neglecting useless data; not being fooled by accounting tricks put in place to disguise operational and/or financial losses.
Double entry, provisions, depreciation, fixed assets, reserves, goodwill, financial income, short/long-term payables and receivables are just some of the concepts you need to know.
Macroeconomics (2) provides the tools to understand what stage of the business cycle the economic sector being analyzed is in, either one’s own country or foreign economies, and the main elements to be explored are:
- Interest rates;
- Inflation rate;
- Unemployment;
- Gross domestic product;
- Public finance;
- National and international legislation.
Please note: Legislation is not a purely and strictly economic topic, but it is very relevant here, as not only a business but also an entire industry can prosper or wither as a result of legislative interventions.
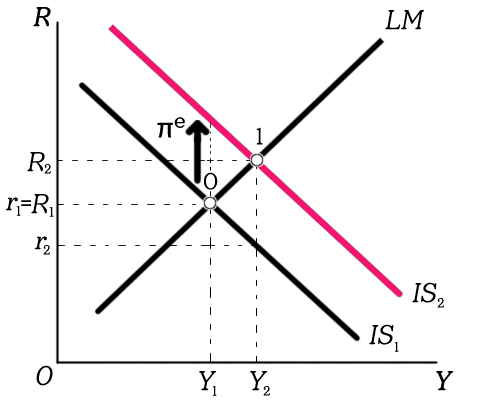
The constitution of a portfolio must be weighted with these factors because they can also heavily affect its performance. For example, the central bank raises interest rates when the inflation rate rises rapidly, so interest rates on government and corporate bonds rise because bondholders expect real yields to be positive. The nominal yield is simply the rate of a bond, while the real yield is equal to the difference between the rate of a bond and the rate of inflation.
If inflation is 3% and the bond rate is 5%, the nominal return is 5%, the real return is 2%. Indeed, people often ask what the expected return will be on an investment net of inflation.
This phenomenon is very relevant because some asset classes are very attractive in certain macroeconomic environments, while they become risky and insecure in others.
Psychology (3) is greatly underestimated by investors and speculators. Regardless of the style in which one trades in the markets, knowing oneself allows one to apply the knowledge gained from studying the above two subjects without getting caught up in emotionalism.
In particular, it is necessary to be disciplined psychologically so as not to fall into the trap that the market sets: the oscillation between fear and greed. If you are not psychologically determined and prepared, you will tend to sell in panic when prices have fallen and buy ineuphoria when prices have risen.
It is difficult to examine specific cases because each person has different psycho-emotional characteristics from others, so the inner analysis can only be an individual path.
Not only one’s own psychology matters, but also that of the management of the company being analyzed. Shareholders and bondholders should ask themselves whether managers are efficient, and this is assessed by looking at major industry competitors for profitability, size, and competitiveness.
Warren Buffett argues that good management should set realistic goals, build its business from within and not through outside acquisitions, allocate shareholder and bondholder capital wisely, and not give out multi-million dollar stock option packages.
To quote Warren Buffett again, another of his teachings from his investment philosophy is: “first know, then invest.” Knowledge can, unfortunately, be a double-edged sword: on the one hand, it is well known that those who know choose and those who do not know believe they choose; on the other hand, one must beware of the so-called home bias, because one runs the risk of overestimating one’s expertise on a subject one knows.
PROSPECTS
Reasoning simultaneously on two distinct levels of magnitude allows one to get a general picture of what has happened in the market in the past, what is happening in the present, and what would be reasonable to expect in the future.
From a macro perspective, traditional financial markets as a whole are basically interested in three elements:
- Real growth: growth in the profits of an individual firm or in aggregate in the productivity of an economic sector or an entire country, that is, in gross domestic product;
- Inflation growth: a rate of inflation stably around 2 percent as from 1991 to 2021 was welcome because it stimulated investment, while a volatile inflation rate pushing into double digits creates chaos in the economy, as in the period from the late 1970s to the early 1980s;
- The change in the propensity to speculate: the emotionality of most investors and speculators accentuates bullish and bearish phases of the market, so it should be kept in mind that going against the tide is a good idea when optimism becomes unsustainable or pessimism unwarranted; one must be realistic.

From the micro point of view, when one has to evaluate an individual enterprise, the criteria to be evaluated are essentially the following:
- Profitability: how much is the profit margin for each product sold/service provided? How much is the ROIC (Return On Capital) worth? It would be better if it were between 7% and 10%.
- Stability: how have your profits been in the last 10 years? It would be better if there have been no losses in the last 5 years.
- Growth: are the previous year’s profits higher than those of previous years? It would be better if profits grew slowly but steadily (in other words, the growth trend should look more like a marathon than a sprint).
- Financial position: long-term debt should be under 50 percent of total capital It would be good to check whether financing is fixed or variable rate.
- Dividends: if a dividend is paid, have dividends been paid continuously for the past 20 years? It would be a sign of good security for the stock if the answer is yes, but we will elaborate on the concept of security in a moment.
- Price history: what is the price trend of the stock in question? This question is answered by cyclical-technical analysis.
METHODOLOGIES
The growth approach is to invest in publicly traded companies, even paying a fairly high price to buy their stocks, which usually have little history, medium-to-high capitalization, and high growth potential of both business and stock price; an obvious example is technology stocks, such as AAPL and AMZN, on the Nasdaq100. It goes without saying that the risk involved in investing in such stocks is higher than in the stocks we will discuss in the next section.
The value approach is to invest in listed companies that have stock prices that are undervalued relative to their intrinsic value. Price asymmetry in the market often occurs because the underlying business is not expected to have tremendous growth potential, which in fact pays out coupons and distributes dividends to make its bonds and stocks attractive. These companies generally have low price-to-earnings ratios, and these are companies that operate in mature industries, such as oil, automotive, or utility companies.
Clearly these are not two completely different methods from each other, as in many cases it is possible to use one as the main one and occasionally use the other as a complementary factor to one’s analysis. In addition, in growth economic phases it makes more sense to make greater use of the growth approach to achieve satisfactory returns, while in downturn economic phases it makes more sense to make use of the value approach to protect one’s capital.
MULTIPLIES
The following are two simple but interesting examples for carrying out fundamental analysis on any listed company and are a good starting point even for inexperienced investors. In any case, it is advisable not to rely solely on a couple of formulas to decide where and how much capital to allocate.
EPS, short for Earnings Per Share, is the measure that represents the portion of a company’s earnings allocated to each outstanding share: net earnings are divided by the total number of outstanding shares. The formula for calculating EPS is as follows:
EPS = Net profits of the company/Total number of shares outstanding.
Investors often view EPS as an indicator of a company’s profitability. A high EPS indicates that the company is generating high earnings per share, which is theoretically a positive sign for the company’s profitability. However, it is essential to consider the EPS of the company being evaluated in the context of the industry in which it operates to get a clearer picture of its situation.
P/E ratio, short for Price/Earnings, is a financial ratio that indicates how much investors are willing to pay for each dollar of the company’s earnings. In other words, it is the ratio of market price per share to EPS.
The P/E ratio is calculated by dividing the market price per share (how much investors pay to buy a stock) by the EPS. Once the EPS is calculated, we can move on to the price/earnings ratio, and the formula is as follows:
P/E ratio = price per share/EPS
A higher P/E may indicate that investors have optimistic expectations for the company’s profitable future, while a lower P/E indicates the opposite.
Earnings Per Share (EPS) and Price/Earnings ratio (P/E) are both financial indicators used by investors to assess the profitability and value of a stock in a publicly traded company.
In summary, while EPS represents earnings per share, the P/E ratio relates this earnings to the market price of the share.
As mentioned earlier, there are other multiples to calculate that are very useful, such as price/book value (price to book value, P/B), price/cash flow from operations (P/CFO), and price/sales (price to sales, P/S).
Of interest is the situation of the forward P/E, because it is a totally misleading figure, because estimating future earnings looks more like predicting the future than performing fundamental analysis on firm and irrefutable data: in approximately 60 percent of cases, forward P/Es have been proven wrong.
FUNDAMENTAL ANALYSIS IN THE CRYPTO SECTOR
Physical replication ETFs on both Bitcoin and Ethereum were approved in 2024 and at the time of writing are enjoying considerable success in the U.S. financial markets. The introduction of these financial instruments is a paradigm shift for the crypto sector, as it offers the opportunity for numerous economic players and market participants to invest capital of an order of magnitude previously unknown to cryptocurrency enthusiasts in Bitcoin and Ethereum.
The other side of the coin may be less pleasant, as it is very likely that if these instruments are very successful, then the price action of the underlying assets will depend greatly on the choices of investors and speculators who use ETFs to trade. Taking the point of view of those who ascribe cryptocurrencies as an alternative to the traditional financial system, ETFs do not consist of a positive innovation for the crypto sector, as it is as if Wall Street is slowly taking control of it.
It would be better if quite a bit more time elapsed before reliable statistical series could be formulated to establish the degree of correlation between the classic markets, Bitcoin and Ethereum, and to assess the impact of spot ETFs. However, it can be assumed that such instruments are used by entities that are different from those who trade and trade cryptos directly in centralized and decentralized exchanges; probably those who prefer to take advantage of the vehicle offered by ETFs, such as family offices, investment funds, professional investors, and so on, will be much more sensitive to changes in the direction of traditional markets, particularly the stock market.
The inference is that the crypto sector is being integrated into the global financial system, but it may not be a good vehicle for diversifying one’s portfolio, because its volatility will presumably increase if the correlation with classic markets increases over time.
BITCOIN (BTC)
Here it pays to place Accounting on the back burner and focus on Macroeconomics and Psychology when conducting fundamental analysis in the crypto sector, because there are neither corporate nor public finances to evaluate.
One cannot but start with the asset that comprises roughly 50 percent of the capitalization of the entire crypto sector: bitcoin.
Bitcoin has been defined by the U.S. regulator, specifically the Commodity Futures Trading Commission (CFTC), as an asset equivalent to a commodity. In the same way as gold, silver, and so on, Bitcoin does not present quarterly earnings to shareholders, does not issue coupons, and does not distribute dividends-this is important because it narrows the number of criteria that can be applied for analysis, e.g., EPS and P/E cannot be calculated.
The nature of this strange asset changes depending on where one looks at it from: the Bitcoin Spot ETF article argues that it is very similar to gold, but Bitcoin can also be likened to a growth stock, such as a technology stock, thus with very high growth potential and high risk.
The price of Bitcoin in the medium to long term is moved considerably by the following reasons:
- Adoption: Bitcoin is a trustless and permissionless computer protocol that follows laws and trends of mass adoption equal to or greater than the development of the Internet;
- Network: miners, validator nodes, computer developers, and so on constitute the structure on which users and investors rely, and the more solid it is, the better it will withstand future challenges;
- Liquidity: an expansive economic phase during which central banks devalue their currencies by injecting liquidity into markets and the economy (as happened in 2008-2021) is very conducive to risk appetite;
- Supply: closely related to the concept of liquidity is that of the limited and unchanging supply of coins (21 million), from which one has to subtract from the total roughly 3 million bitcoins, which is the estimated number of coins lost forever;
- Halving: these have always been “bullish” events, in that the halving of the reward for miners determines that the production (or mining) of bitcoins halves every 4 years, according to the rules of its blockchain, but one should not assume that its price increases solely and exclusively because of this event, because it is so notorious that the market either prices it far in advance or not at all;
- Mining: since bitcoin has no real connection to the real economy, one of the values that can be considered to establish the intrinsic value corresponds to the cost of producing 1 bitcoin in terms of electricity used, thus €/kWh;
In the short run, however, much of the price fluctuation depends substantially on derivatives, particularly the trading volumes of perpetual futures contracts, which can generate fictitious supply or demand and quickly move the price in one direction or the other.
Although Bitcoin is not very connected to the real economy, the monetary and fiscal policies of the world’s major economies, including the United States, the European Union, China, and Japan, can influence the trend of its price.
We have mentioned that stocks and bonds, commodities and currencies react to changes in the trend of the inflation rate: in general, a stable inflation rate of 2 percent is positive because it stimulates the conversion of money from the form of savings to investment, while both deflation (prices of consumer goods and services falling) and hyperinflation (prices of consumer goods and services rising out of control) are negative for markets, as the economy cannot flourish in these contexts.
It is frequently debated that Bitcoin is an inflation hedge, but is this really the case? Actually, it depends a lot on the time interval considered: the price of Bitcoin has had incredible rises in some years and devastating collapses in others. Until 2020, the correlation with the U.S. stock and bond market had been very low, then huge fiscal and monetary stimuli were injected into the economy and financial markets by the governments and central banks of the world’s major economies, so Bitcoin and many other assets correlated based on the concept of: “A rising tide lifts all boats.”
The exponential increase in liquidity caused the upward explosion in the prices of consumer goods and services: in this sense, Bitcoin can be said to have excellently defended the purchasing power of one’s money from rising inflation before it manifested itself in the real economy.
On a purely conceptual level, the fixed supply of 21 million coins acquires more value when the currency in which they are priced, the U.S. dollar, is devalued due to injections of liquidity into the economy and markets. In contrast, restrictive monetary and fiscal policies are theoretically disadvantageous to the price of Bitcoin.
These dynamics were almost totally nonexistent in the periods before Bitcoin was institutionalized.The task of fundamental analysis is also to understand who the market participants are, because their ways of reasoning and trading depend on their nature.
Interestingly, in the event of hyperinflation of the fiat currency, there would be a precipitous flight from stocks and bonds, as no investor would want to hold assets priced in a currency that is spiraling out of control, and the prices of hard assets such as gold and Bitcoin would skyrocket, because it is as if they constitute another form of currency, which would be more stable than fiat at that time. The price of Bitcoin would go up, but that situation would not be desirable at all, as all of society would plunge into total chaos.
REPLICATE THE METHODOLOGIES OF CLASSIC MARKETS TO CRYPTO
It is a good idea to begin the fundamental analysis of any crypto, including Bitcoin, with reading the whitepaper and studying tokenomics.
The growth approach in cryptos, echoing the definition written in the section “THE METHODOLOGIES,” is very easy to apply as all sectors of the crypto world have experienced stellar performance in the 2020-2021 bull market. Gaming, NFT, memecoin, metaverse, De-Fi-each of them had their moment of glory in that two-year period. Going into the practice of growth investing, it can be said that one category of cryptocurrencies that is likely to perform well in the coming months and years will be artificial intelligence (AI), regardless of whether the underlying project is able to add value to stakeholders.
If investment in artificial intelligence globally goes ahead, it would not be strange to see the return of speculation in both equities and cryptos that are involved in AI development.
Instead, in the case of memecoins, there was (and still is) not even a sliver of intrinsic value, so analyzing them from the perspective of value investing would have been a colossal mistake.
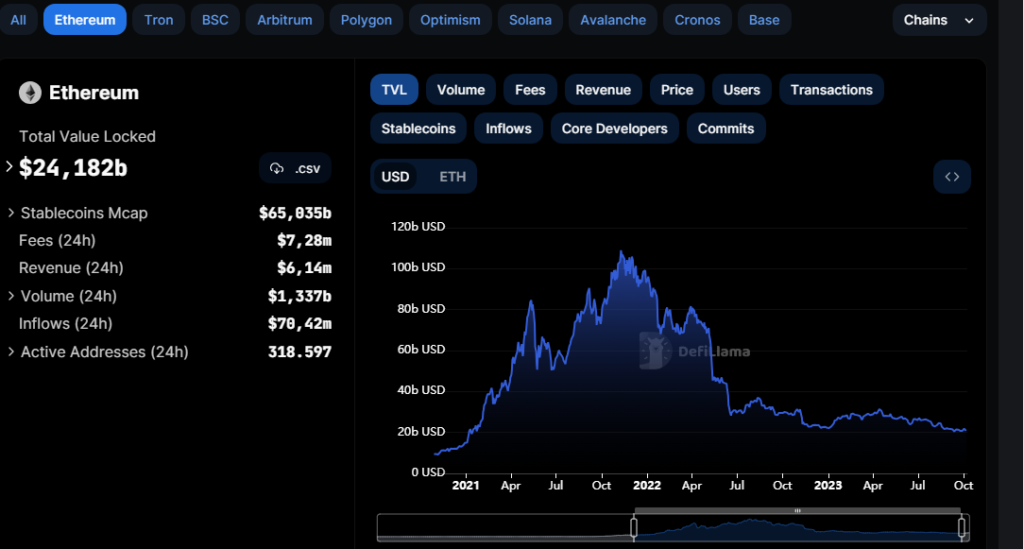
The value approach in cryptos seems at first glance an absurdity because the entire industry is based on the concept of exponential growth, mass adoption, and high technological development. Yet a kind of fundamental value analysis can be sketched: it is not impossible to find a crypto that produces profits, exhibits high Total Value Locked (TVL), and has been momentarily forgotten by most investors and speculators.
Getting into the practice of value investing, in the crypto sector profits come from fees from transactions made on the blockchain; take the case of Ethereum (ETH): the “gas” is the amount of gas used to make a transaction, and fees must be paid in Ethereum’s native currency, ether (ETH). The commission is paid regardless of whether a transaction is successful or not, and the price of the gas is usually stated in in the unit of measure “gwei.”
Total Value Locked (TVL) is a metric used to measure the total value of digital assets locked in a particular decentralized finance platform (De-Fi) or decentralized application (dApp). The higher the TVL, the more trustworthy the platform or dApp is perceived to be, so it is likely that adoption of the network will be wide and the price of the reference coin, as well as the tokens circulating on that blockchain, will increase over time.
To conclude this paragraph, it should be mentioned that all cryptocurrencies are very dependent on technical-cyclical analysis for price action, much more so than stocks and bonds.
MARKET INDICES AND INDICATORS
We should keep in mind that Bitcoin’s capitalization is roughly half of the capitalization of all existing cryptocurrencies, but there are some very useful tools, indeed charts, easily found on TradingView, to assess how the entire sector is moving.
TOTAL
Very similar to the S&P500 index of the stock market, it is the aggregate sum of the capitalizations of all cryptos and is expressed in USD. It should be looked at from time to time since it eliminates “background noise,” i.e., it makes the trend that is characterizing the crypto sector (bullish, bearish, sideways) “cleaner,” so it makes sense to apply technical-cyclical analysis to understand how the market is moving. Obviously, it is not possible to invest in this instrument, and the same goes for the next two.
TOTAL2
Excluding the capitalization of Bitcoin results in a chart that conceptually resembles that of the Nasdaq100 index because it tracks what happens to the capitalizations of all altcoins and Ethereum. Therefore it is more volatile than TOTAL and reflects market conditions by adding an extra layer of risk, in the sense that Ethereum and altcoins are riskier (and less safe) than Bitcoin, but this concept will be explored later.
TOTAL3
By maximizing the riskiness of the underlying assets, TOTAL3 excludes the fluctuations of Bitcoin and Ethereum, so it is very sensitive to so-called altseasons and bear markets. It closely resembles the Russell2000 index, which essentially represents “the base of the economy” in the U.S. in that it groups together small-cap equities.
TOTAL, TOTAL2 and TOTAL3 are good charts to keep on the watchlist to analyze the long-term trends in this sector.
Without getting too deep into matters of technical analysis expertise, there are three other elements to consider when getting a macro picture of the situation in the crypto sector.
BTC.D
Bitcoin’s Dominance is a derivative indicator that consists of repurposing the concept of TOTAL in a percentage key: the value of BTC.D corresponds to the percentage weight of Bitcoin’s capitalization relative to all other cryptos.
If BTC.D’s trend is positive, then Bitcoin’s price is stronger than that of other cryptos because it absorbs most of the liquidity in the market, therefore:
- Its capitalization increases more consistently than that of altcoins, which cannot maintain as bullish a trend as the leader;
- Its capitalization decreases less than that of altcoins, which show a much more pronounced bearish trend than that of Bitcoin.
If BTC.D’s trend is negative, then Bitcoin’s price is weaker than that of other cryptos because there is a rotation of capital into altcoins, which are more speculative and risky.
Generally, if Bitcoin dominance is trending positive, then either (1) the crypto sector is beginning a bull market phase or (2) a “flight to safety” is underway, which is a typical attitude of assets during a bear market. Downtrending in dominance almost always occurs when, precisely, asset rotation occurs in the middle and final stages of a bullish cycle.
In the stock market, a similar concept can be glimpsed in “market breadth,” that is, the percentage of equities whose prices stay above major moving averages, such as the 200D SMA (ticker symbol: MMTH) or the 50D SMA (ticker symbol: MMFI).
It frequently happens that a rally in the S&P500 index is corrected heavily when the participation of most equities is low, thus if their prices are below the moving averages just mentioned.
The opposite is also true: when the S&P500 index collapses without the downturn being accompanied by most stocks, then it is likely to be corrected with a very strong upward movement in the price.
Occasionally such a discrepancy in attitudes occurs because of the enormous weight of the so-called mega-cap stocks, such as the FAANGs, whose fluctuations are enormously impactful on the performance of stock indexes. In this regard, there is a NYSE Arca-listed ETF called RSP that corresponds to the equated index of the S&P500: RSP can also be used as a confluence agent in the merits of an analysis.
ETHBTC
This ratio is most important in the crypto sector because it determines, similarly to BTC.D, risk-on and risk-off sentiment over a period of time. It is the ratio of the price of an ether in USD to the price of a bitcoin in USD. If the ETHBTC chart has a bearish trend, it means that a “flight to safety” is taking place, which is the same dynamic that occurs in traditional finance and can be observed in the ratio: XLP/XLY. These tickers correspond to the following formula: consumer staples/consumer discretionary.
Basically, the ratio of the prices of stocks of companies selling “essentials” goods to the prices of stocks of companies selling “non-essentials” goods is calculated. The basic concept is that during a downturn in the economy, consumers cut back on spending on luxury goods, but it goes without saying that they continue to consume essentials. Based on the nature of these relationships, it is clear from the charts that the uptrend of XLP/XLY is equivalent to the downtrend of ETHBTC in terms of its impact on risk appetite. Of course, the opposite is true.
VOLATILITY
In traditional finance the chart ticker that is the VIX. Volatility increases when price fluctuations are extreme, and it is important to keep an eye on it, because it is precisely at times when the price reaches levels far removed from historical averages that one must consider whether to buy or sell.
When volatility is low, it is generally better to hold on to one’s positions because the price has reached an equilibrium price between supply and demand, and this applies to both a speculator and an investor.
In the crypto sector, one can follow BVOLUSD, BVOL24H, and BVIV to analyze the volatility of Bitcoin at historical and intra-day levels, respectively. Generally, volatility is something that should be considered in fundamental analysis in terms of confluence: the more factors that lead the analysis to a conclusion, the more likely that conclusion will prove to be correct.
INVESTOR AND SPECULATOR
The main difference between investor and speculator lies in their attitude toward the market:
- Speculator ‘s primary interest is to predict and exploit price fluctuations;
- Investor ‘s primary interest is to acquire and hold attractive securities at prices that in his analysis are appropriate.
Market movements are important to the investor only in a practical sense, in that, having completed the fundamental analysis on one or more securities, he will be able to take advantage of market declines to build a position on that or those analyzed securities.
A speculator is defined as such when he or she is not a professional and when he or she is operating on the margin, that is, exploiting leverage. There are profitable and appropriate ways of doing this activity, which we can summarize in the term “trading,” but it certainly should not be done when:
- One confuses speculation for investment;
- One speculates seriously but without competence, rather than as a pastime;
- One risks more money than one can afford to lose.
There are various trading styles from the point of view of operation, of which the main ones are: trend-following, mean reversion, chart pattern recognition, and exogenous signal. From the point of view of range, one can specialize in swing trading or scalping–everyone chooses what suits them best based on their risk appetite, how much time, energy, and capital they have available, and so on.

Another popular belief that the facts show to be unwise is to inextricably link expected returns and the age of the investor. In fact, nowhere is it written that one should operate more defensively as one gets older.
The aggressiveness of one’s portfolio depends solely and exclusively on the effort the investor is willing to put into studying the above subjects, understanding how the market works, analyzing stocks and bonds (and cryptos), and psychological self-discipline.
By having an enterprising and active attitude is meant the ambition to “beat the market,” that is, to obtain a return that is greater than that of the main U.S. stock index, the S&P500.
Taking two extreme examples, a 20-year-old can safely build a defensive portfolio, running on autopilot, divided into: 75% bonds, 15% stocks and 10% cash. A 65-year-old lady can safely have exposure to Bitcoin, should she understand what she has put in her portfolio.
DIFFERENCE BETWEEN RISK AND SECURITY
Risk is a probabilistic concept that should be associated with the performance of financial transactions but many people confuse it with the safety of capital.
Risk depends strictly on the volatility of the price of the asset in which one invests or speculates on: for example, it is risky to buy a security following a huge rise in price or to sell it following a large fall in price.
In general, a security is risky when paying a price that is too high in relation to its intrinsic value: the risk is in losing part or all of the capital due to poor management by the investor or speculator in the conduct of trading.
Security, on the other hand, relates to the certainty that the capital will be returned once the investment or speculation is over.
Security of capital consists, for example, in making sure that bond coupons and stock dividends are continuously distributed: if they have failed in the past or if they will not be delivered at the next maturity date, then the securities are unsafe and in some cases totally unsafe.
As mentioned earlier, study the dividend and coupon history of a listed company to assess not only what returns can be reasonably expected but also the safety of the capital before investing it.
CRYPTO SECTOR VS. TRADITIONAL FINANCE
RISK
Is bitcoin risky? This question is frequently asked and-as seen before-the riskiness of Bitcoin depends solely on the current price compared to the intrinsic value, which is assessed through fundamental analysis.
Bitcoin has historically been more volatile than most commodities and stocks and bonds, so periods when risk is very high are more frequent than for traditional finance assets. It has been noted that its average volatility has lowered in the last 2-3 years compared to that seen in the early years of the main cryptoasset’s existence: as capitalization increases, volatility decreases, so the level of risk that one’s capital takes when investing or speculating also decreases.
Ethereum and altcoins are extremely more volatile than both Bitcoin and assets in the classic markets, so the risks one can take are far greater. However, the greater the risk, the greater the potential return.
Some equities have become very risky in the recent past: these were the “meme-stocks,” such as GameStop, whose fluctuations corresponded in all respects to the memecoins of the crypto sector, keeping in mind, however, that meme-stocks were still shares of tangible companies, so the two cases do not overlap 100 percent.
Anyone, regardless of whether they are an investor or a speculator, who does not have the stomach to withstand the extremely high volatility of cryptoassets should focus their attention on traditional finance, because it is not worth living with the anxiety of not knowing where crypto prices are going at any time of the day because of the enormous volatility.
SECURITY
Continuing the comparison between the crypto sector and traditional finance, let us move onto much more slippery ground than the one immediately before. Individual biases are much stronger in this topic than in other topics, so it is best to be as objective as possible.
It has been said that full security consists in the certainty that the invested capital will be returned in full at the end of the financial transaction or of the investment in general. In the case of crypto, this topic is quite controversial and it is convenient to start with Bitcoin.
First, it is necessary to study how the blockchain works in order to properly assess security.
After all, Bitcoin is a computer protocol, not a manufacturing or service enterprise, so one must basically:
- Assess the decentralization and distribution of the network of miners and validator nodes;
- Quantify the probability of a cyber attack or bug in the blockchain;
- Analyze BIPs, which stands for “Bitcoin Improvement Proposal,” that developers submit to Bitcoin holders;
- Hypothesize scenarios where in the future artificial intelligence and/or a supercomputer manages to damage the computer protocol or the holders’ funds.
Second, it is fair to recognize in Bitcoin the absence of the “H factor” (human factor) as an advantage.
Investing in Bitcoin is safer than buying stocks of many listed companies and bonds of some states because its operation is mathematical: Satoshi Nakamoto structured a code that was able to function without humans being needed.
It is true that miners and validator nodes are essential to the operation of the blockchain, and these are managed by individuals, but human input is far less than in any enterprise, regardless of the economic sector to which it belongs. It is a well-known fact that human error happens sooner or later and causes even serious damage, so minimizing the human factor increases the degree of security.
The same argument can be shifted to those countries ruled by corrupt and irresponsible people who are either unable to manage the economy or who take advantage of it to enrich themselves: their currencies and government bonds are little more than waste paper.
The only real source of problems for Bitcoin has always been (and still is) the presence of centralized and decentralized exchanges, which are either run by people or by programs and algorithms set up by people. Hacker attacks have been perhaps the most important cause of loss of one’s bitcoins, one need only recall the Mt. Gox incidents in 2014 and Bitfinex in 2016.
The highest levels of security with bitcoin are achieved by withdrawing funds from exchanges and transferring them to an offline hardware wallet.
A final issue to be resolved on this issue consists of what we ourselves do, in fact so many bitcoins have been lost over the years due to carelessness: forgetting the location of the hardware wallet or the seed phrase, breaking the hardware wallet, and so on. One’s funds must also be protected from oneself.
Third, another matter to be dealt with consists of political-legislative threats.
Compared to the previous two, this one is certainly less relevant in that it is less dangerous: anyone living in countries with an advanced economy and a democratic political system can rest easy, because enforcement actions such as the numerous Bitcoin bans filed by China over the years are and will be as unlikely as they are useless.
Turning to the world of altcoins, the level of security to expect compared to traditional markets is nothing short of dismal. In the same way that the episode of IPOs in the 1990s and ICOs in 2017-2018 unfolded, concrete examples can be brought to bear on what has happened in the past and what may happen in the future:
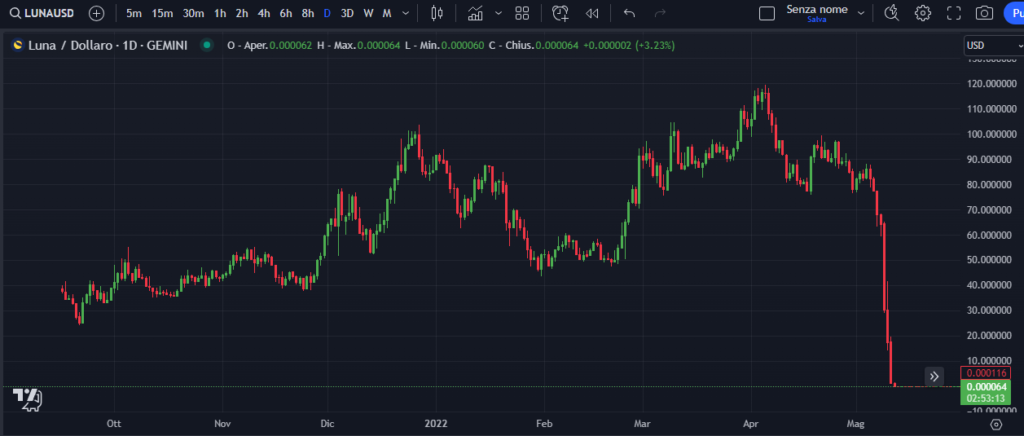
- The collapse of Terra (LUNA) in 2022 closely resembles the Enron (ENE) affair in 2001;
- The failure of the crypto industry’s largest investment fund Three Arrows Capital in 2022 is very similar to that of Long Term Capital Management (LTCM) in 1998;
- The collapse of FTX-Alameda, the second largest exchange in the crypto sector, in 2022 was as disastrous for the sector as that of the failure of Archegos Capital Management in March 2021, in which $20B in AUM went up in smoke in a very short time and a meltdown of the financial markets was risked; The affair of Sam Bankman-Fried, founder and former CEO of FTX, is reminiscent of the Bernard Madoff affair.
There is no regulation to support small investors in case an exchange fails, an altcoin collapses to zero, one is scammed, becomes a victim of phishing, and so on.
In altcoins, the H-factor mentioned above is definitely present, because there are developers behind every project and you cannot be sure that they are working in good faith.
In most cases, it is unwise to be a “long-term holder,” meaning to invest with a reference period of 1 or more years, of one or more altcoins, as the likelihood of never seeing the capital returned increases as time goes by.
WITHIN THE CRYPTO SECTOR
In this section we will need to narrow the focus from global financial markets to the crypto sector.
RISK
If the crypto sector were a sea, Bitcoin would be like a beacon surrounded by riskiness and insecurity.
Of course, Bitcoin’s massive capitalization makes it less volatile than Ethereum and altcoins, so it is certainly less risky. However, Bitcoin is not the least risky cryptoasset overall. Stablecoins are the only cryptoassets with near-zero risk, particularly Tether (USDT).
It is worth mentioning that some stablecoins have collapsed to 0 in the past, such as UST, the stablecoin of the Earth ecosystem (LUNA), as it was not only algorithmic but also part of a pyramid scheme. These are the types of stablecoins that currently exist:
- Fiat-backed;
- Crypto-backed;
- Commodity-backed;
- Algorithmic stablecoin.
One must also consider that each is pegged (i.e., “tied”) to the value of a fiat currency, which in most cases is the U.S. dollar (USD). However, the value of a stablecoin is almost never 1:1, because stablecoins are also subject to the law of supply and demand.
Indeed, it happens that 1 USDT = 0.998 USD or that 1 USDT = 1.001 USD. In those cases, there are market participants who perform the arbitrage function to constantly balance supply and demand so that the “price” of stablecoin remains as equivalent to 1 USD as possible.
The concept to remember is that the capital in the form of stablecoin neither increases nor decreases except when a black swan occurs, and this perfectly complies with the golden rule of financial markets: zero risk, zero return.
Having to make a rough ranking of risk, they could be ordered as follows, from least risky to most risky:
- Stablecoin
- Bitcoin
- Ethereum
- Altcoin
- Memecoin
It is true that memecoins are part of the altcoin set, but they do not bring any kind of added value and are not part of any innovative project, unlike metaverse coins or gaming and so on. Any fluctuation in the price of memecoins is mere speculation for its own sake, therefore totally unpredictable and very risky.
SECURITY
Continuing to keep the focus of attention within the crypto sector, the ranking just compiled changes, but not shockingly.
In the case of security Bitcoin reigns supreme, as even stablecoins are less secure. However, as mentioned in the chapter “CRYPTO SECTOR VS TRADITIONAL FINANCE,” particularly in the section on security, the highest possible rank is achieved through the use of a hardware wallet.
In recent years some altcoins have failed because they were hacked, because they were scams, because the developers abandoned the project, because the market completely forgot about their existence, and so on. The same is true for centralized and decentralized exchanges, now as in the past.
The ranking of cryptoassets from the safest to the least secure would then be as follows:
- Bitcoin
- Ethereum
- Stablecoin
- Altcoin
- Memecoin
How is Ethereum (ETH) more secure than stablecoins? The only major problem with stablecoins comes from regulation: unlike all other types of crypto, stablecoins are direct competitors to fiat currency, so they potentially run the danger of becoming illegal.
Ethereum is nothing more than an ecosystem on which dApps can be built and ether transactions can be conducted for various reasons, so it does not currently pose a danger to either states or central banks.
USEFUL TOOLS FOR INVESTORS AND SPECULATORS
Since we live in the 21st century, it is no longer necessary to wait for paper mail to get news from someone.
Following the news is important: an investor should keep abreast of what is happening in the world, as sudden shifts in the supply and demand balance of the securities and/or assets in his or her portfolio may occur; a speculator should do the same as events may occur that create either euphoria or panic, reactions that almost always generate movements in prices from which to profit.
Completely ignoring websites that disseminate analysis and tell the famous “breaking news” would be unwise, but so would basing one’s investment decisions solely on these sources of information.
Platforms and apps such as Youtube and X (the old Twitter) are also very interesting in the hands of the shrewd user, since, in addition to real-time news, one can find analysis, opinions, and commentary of all kinds.
It is also true that social media is full of misinformation, but there is no need to reiterate concepts already known to everyone.
The idea to take home is to spend time both in the search for new and stimulating information, because the economy and financial markets are very dynamic, and in the individual formulation of independent thinking, which will serve as a reference point in times of uncertainty.
All that remains at this point is to open a chart, select the 1W time frame, and start with technical analysis.